XUC Internal Metrics
Introduction
The XUC process exposes some metrics to troubleshoot or monitor the health of the process. Some of these metrics were previously exposed in a sub-page of the XUC overview page. The metrics are not exposed using the JMX technology available in java.
Configuration
Enable JMX
JMX is enabled by default in java but only available on the local machine running the process. Moreover as we are using docker, it’s only available inside the docker container itself. To make it available from the outside of the container and host running the XUC process, you need to explicitely configure it to do so.
- In the following configuration, replace
JMX_PORT with the port number where you want to expose the JMX
JMX_HOST by the docker host IP address (not the container one but the IP of the server running docker)
Edit your docker compose file (/etc/docker/compose/docker-xivocc.yml) and change the configuration of the xuc container:
xuc:
  [...]
  ports:
  - JMX_PORT:JMX_PORT
  [...]

  environment:
  - JAVA_OPTS=-Xms512m -Xmx1024m -DtechMetrics.jmxReporter=true -Dcom.sun.management.jmxremote -Dcom.sun.management.jmxremote.port=JMX_PORT -Dcom.sun.management.jmxremote.local.only=false -Dcom.sun.management.jmxremote.authenticate=false -Dcom.sun.management.jmxremote.ssl=false -Djava.rmi.server.hostname=JMX_HOST -Dcom.sun.management.jmxremote.rmi.port=JMX_PORT
  [...]
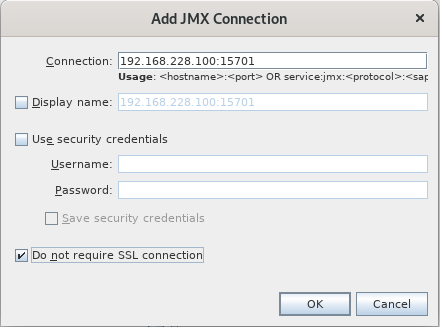
For example, if we have JMX_PORT=15701 and JMX_HOST=192.168.228.100, you should set
xuc:
  [...]
  ports:
  - 15701:15701
  [...]

  environment:
  - JAVA_OPTS=-Xms512m -Xmx1024m -DtechMetrics.jmxReporter=true -Dcom.sun.management.jmxremote -Dcom.sun.management.jmxremote.port=15701 -Dcom.sun.management.jmxremote.local.only=false -Dcom.sun.management.jmxremote.authenticate=false -Dcom.sun.management.jmxremote.ssl=false -Djava.rmi.server.hostname=192.168.228.100 -Dcom.sun.management.jmxremote.rmi.port=15701
  [...]
Then restart the XUC process with the new configuration by running the command xivocc-dcomp up -d xuc
Explore JMX
Once restarted you can then use tools to explore the metrics: jconsole, visualvm with MBeans plugin, eclipse,… For example, here are the steps to configure visualvm and explore the JMX metrics:
Download and install visualvm https://visualvm.github.io/
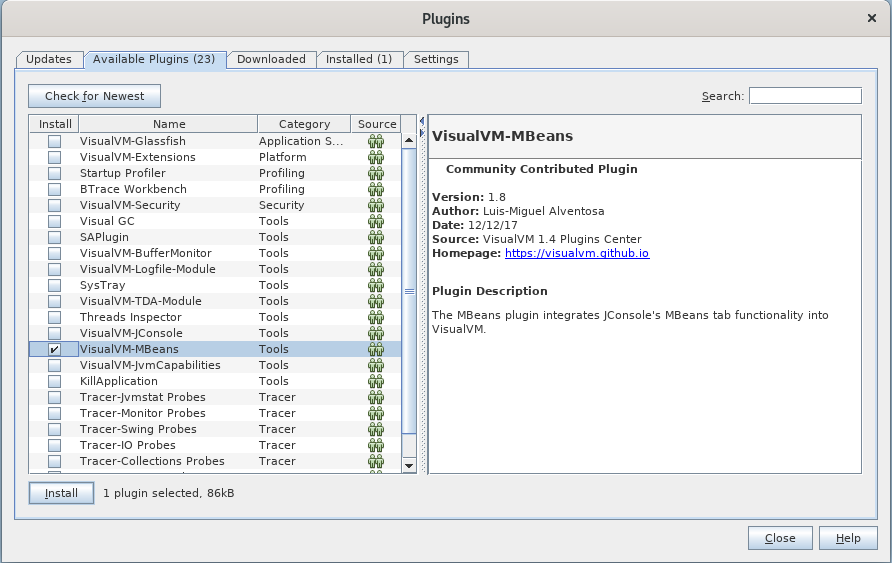
Enable MBeans plugin
Add remote host
Double click on process under the newly added host
Click on the MBeans tab
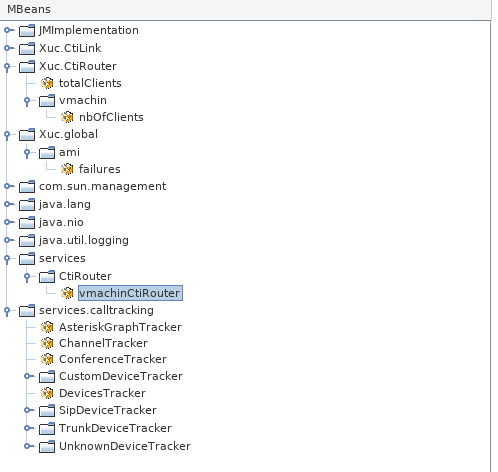
Explore tree
Expose JMX through REST
Alternatively you could integrate a JMX plugin to your running process which allows to gather JMX metrics over HTTP. You need to download jolokia JVM agent from their website: https://jolokia.org/ and transfer the jar file on the server hosting the XUC container (for example in /etc/docker/jolokia/jolokia-jvm-1.6.2-agent.jar).
Then you should change your docker compose configuration for the xuc process in docker-xivocc.yml:
xuc:
  [...]
  ports:
  - JMX_HTTP_PORT:JMX_HTTP_PORT
  [...]

  environment:
  - JAVA_OPTS=-Xms512m -Xmx1024m -DtechMetrics.jmxReporter=true -javaagent:/opt/jolokia/jolokia-jvm-1.6.2-agent.jar=port=JMX_HTTP_PORT,host=JMX_HTTP_HOST
  [...]

  volumes:
  - /etc/docker/jolokia:/opt/jolokia
Then restart the XUC process with the new configuration by running the command xivocc-dcomp up -d xuc. The JMX metrics are now available over HTTP, see jolokia website for help on available endpoints: https://jolokia.org/documentation.html
Here are some example url to test:
* List all jmx metrics available: curl http://JMX_HTTP_HOST:JMX_HTTP_PORT/jolokia/list
* Get metrics of a specific service: curl http://JMX_HTTP_HOST:JMX_HTTP_PORT/jolokia/read/services.calltracking:type=AsteriskGraphTracker
Metrics description
Historical metrics
These metrics were previously exposed in a sub-page of the XUC overview page and are now present in xuc application logs.
Xuc.CtiLink.<username>: Information on the link per user between XUC and ctid on the XiVO PBXstartConnection: Represents the total number of WebSocket opening attempts (whether successful or not, and it only ever increments until the XUC is restarted)stopConnection: Indicates the number of failed TCP connection attempts during these WebSocket openings
Xuc.CtiRouter.<username>.nbOfClients: Shows the number of currently active WebSocket sessions for a user (normally increasing and decreasing as tabs are opened or closed)Xuc.CtiRouter.totalClients: Total number of websocket connected to the XUC (sum from previous counter)Xuc.global.ami.failures: Number of failure/lost connection to the asterisk AMI
New metrics
services.CtiRouter.<username>CtiRouter: Information on the currently connected <username>services.calltracking.AsteriskGraphTrackerGraphSize: Size of the call graphLoopDetected: Number of call loop detectedNotifications: Number of Notifications published internallyWatchers: Number of object monitoring the graph
services.calltracking.ChannelTrackerHangupEvents: Number of Hangup received since the process startedNewChannelEvents: Number of channel created since the process startedNotifications: Number of Notifications published internallyWatchers: Number of object monitoring the channels
services.calltracking.ConferenceTrackerConferences: Number of conferencesParticipants: Number of participants
services.calltracking.DevicesTracker.Devices: Number of monitored deviceservices.calltracking.SipDeviceTracker.<SIP_PEER_NAME>: Information about the SIP peer (Phone device)Calls: Number of active callsChannelEvent: Number of channel event receivedPartyInformation: Number of event received from remote partyPathsFromChannel: Number of event received from the AsteriskGraphTracker
services.calltracking.TrunkDeviceTracker.<TRUNK_NAME>: Information about the trunk, same information as in SipDeviceTrackerservices.calltracking.CustomDeviceTracker.<CUSTOM_NAME>: Information about the custom device, same information as in SipDeviceTrackerservices.calltracking.UnknownDeviceTracker.<CUSTOM_NAME>: Information about other asterisk device, same information as in SipDeviceTracker
Other JVM metrics
You may also find these metrics interesting when troubleshooting the process:
* java.lang.Memory.HeapMemoryUsage: Information about the java heap memory
* java.lang.GarbageCollector: Information about the java garbage collector process