Xuc & Xucmgt (CC & UC applications)
XUC overview page
XUC overview page available at @XUC_IP:PORT, usually @SERVER_IP:8090. You have to check if the “Internal configuration cache database” contains agents, queues etc.
XUC sample page
XUC sample page available at @XUC_IP:PORT/sample, usually @SERVER_IP:8090/sample. You can use this page to check user login and other API functions. CCManager, agent and assistant web use functions available on the sample page.
XUC Internal Metrics
Internal metrics are also available - see XUC Internal Metrics page.
Agent states after XUC restart
Please see the note in restarting XUC server with active calls.
Queue created
New queue will not appear immediately in CCAgent and CCManager until the agent or the manager is not relogged to these applications accordingly. The Xuc server restart is not required.
Queue deleted
Deleted queue will still appear in CCAgent and CCManager until the Xuc server is restarted.
Audio quality issues
If something goes wrong with the quality of an ongoing call, it will be reflected in live, every 20 seconds, inside the xuc server logs, with the following format:
WARN s.ClientLogger- [userw] 1590da900aba2a761573c0493c04a0a1@192.168.56.2:5060 Audio quality issues -> RTT 186ms - Jitter upstream 1ms / downstream 0ms - Packet loss upstream 21% / downstream 6%
At the end of each call, a call quality report will also be sent in the xuc server logs, with the following format:
INFO s.ClientLogger- [userw] 1590da900aba2a761573c0493c04a0a1@192.168.56.2:5060 Call quality report -> Highest RTT 186ms - Highest Jitter upstream 3ms / downstream 3ms - Highest Packet loss upstream 21% / downstream 12%
Both those format include the user as well as the sip call id, so it can be grepped. It can also be grepped by the type of message, “Audio quality issues” and “Call quality report”.
Audio quality visualisation
When needed, a dedicated module can be setup to allow graphical representation of those data. See the following section for more details.
Activation
On XiVO PBX:
In
/var/lib/postgresql/15/data/pg_hba.confadd rights for following users on specific tables (replace the <XUC_IP> with the IP of VM where xuc is running):HOST call_quality_stats rografana <XUC_IP>/32 md5 HOST call_quality_stats rwfluent <XUC_IP>/32 md5Add the service in file
/etc/docker/xivo/docker-xivo.grafana.ymlto/etc/docker/xivo/docker-xivo.override.yml.And finally run:
xivo-dcomp reload db
xivo-dcomp up -d
On XiVO CC / UC Addon:
Add the service in file
/etc/docker/compose/docker-xivocc.fluentd.ymlto/etc/docker/xivo/docker-xivocc.override.yml.And then run:
xivocc-dcomp up -d
Usage
When audio quality visualisation activation step is done.
You can access grafana web page via:
https://<XIVO_IP>:3000/
Replace the <XIVO_IP> with the IP of your Xivo PBX.
Dashboard view :
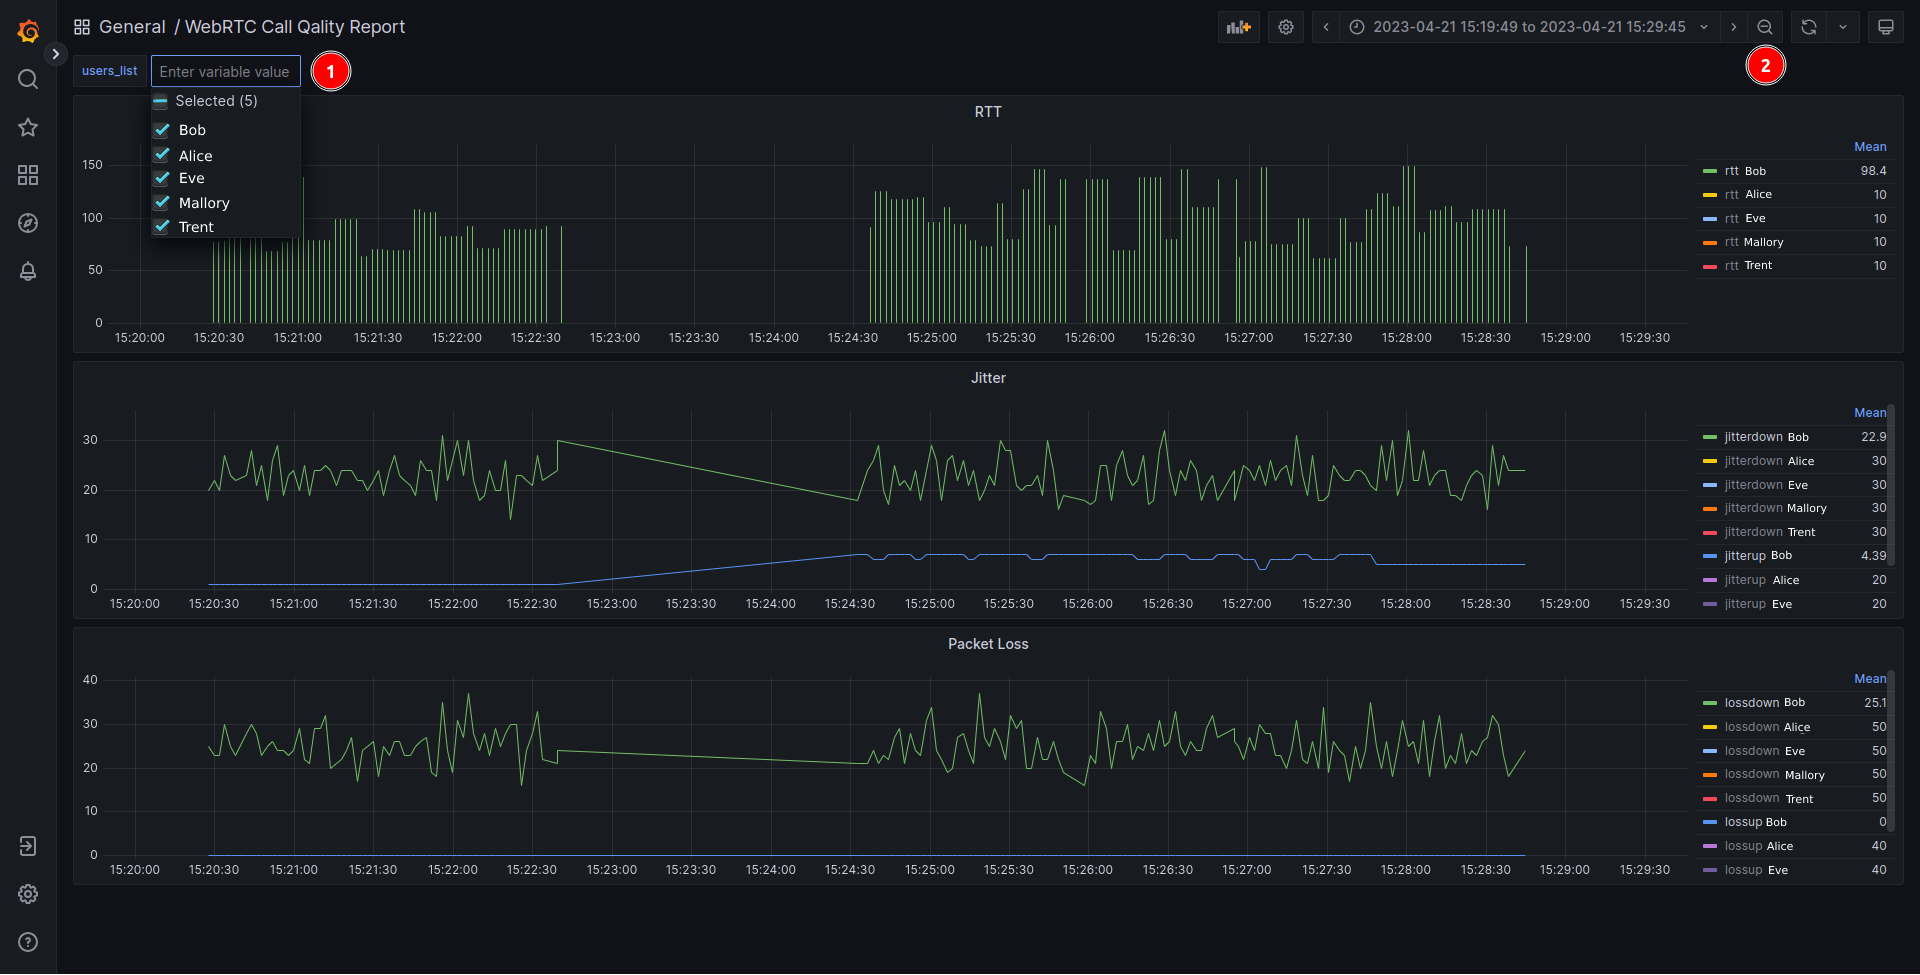
On grafana dashboard you can:
Select user that you want to display thank to the
users_listparameterZoom out by pressing CRTL+Z or by clicking on the magnifier
Warning
All the added dashboards will not be saved in case of update.