Monitoring
The Monitoring section gives an overview of a XiVO system’s status and of all monitored processes. It is divided into 6 sections :
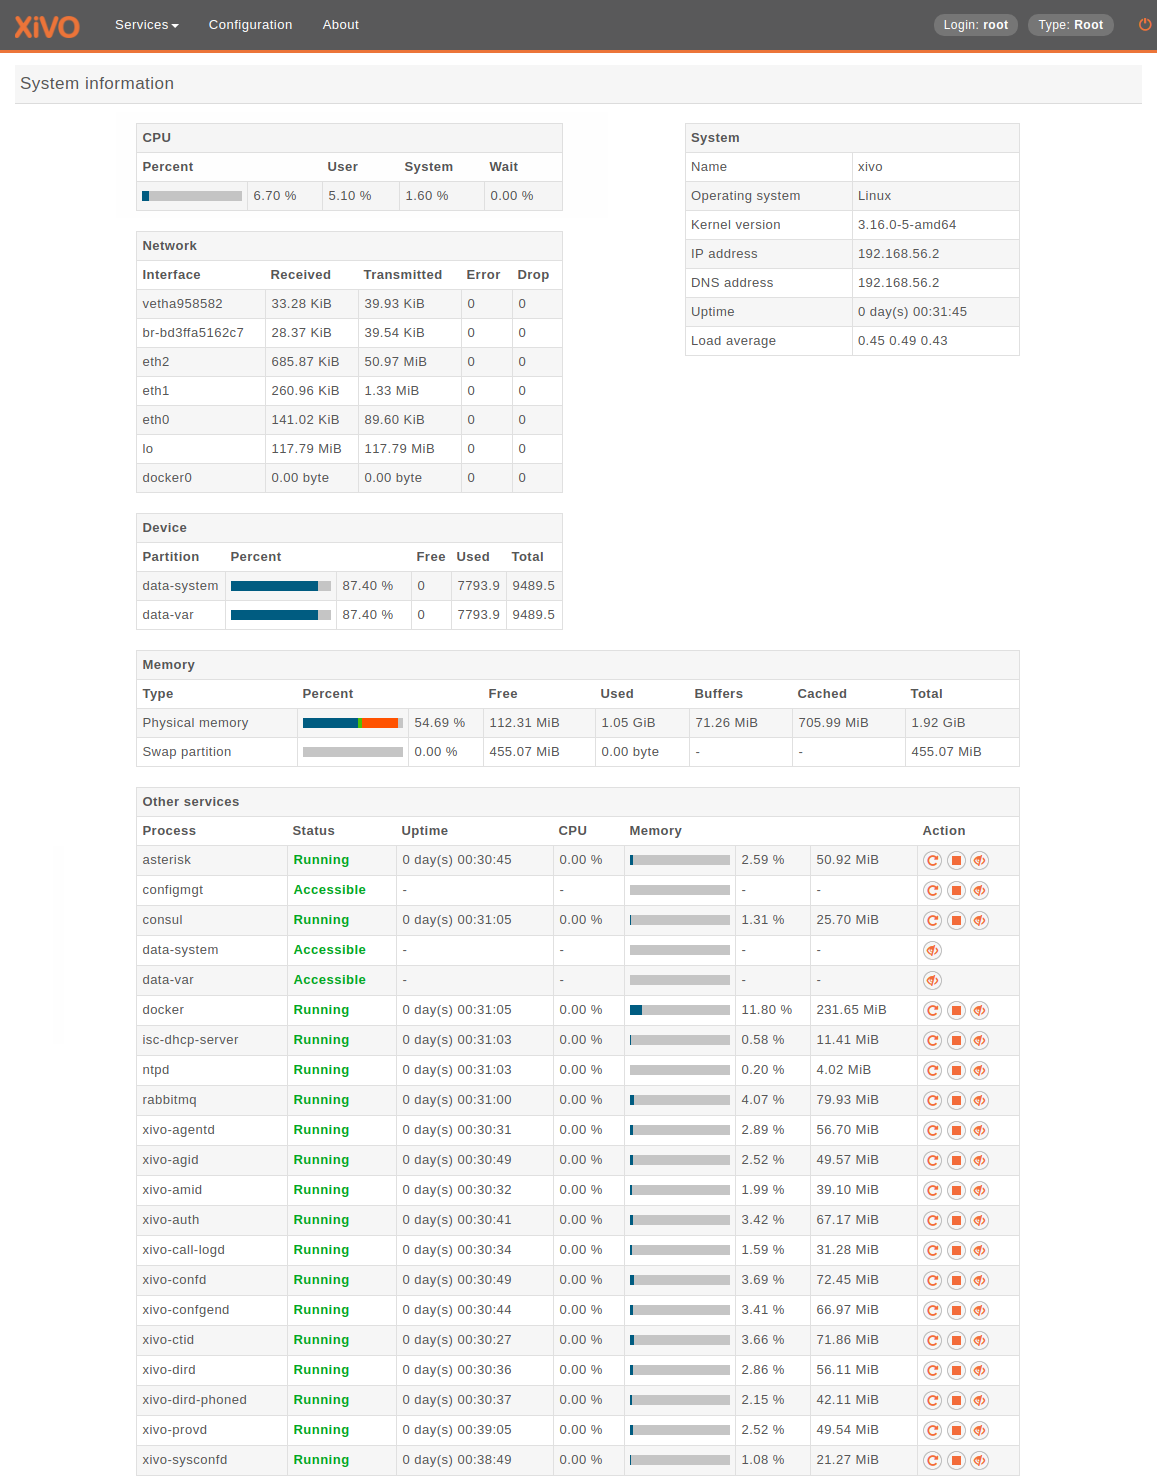
System
Displays generic information about the operating system, network addresses, uptime and load average. Read only.
Device
Displays free/used space on physical storage partitions. Read only.
CPU
Monitors the CPU usage. Read only.
Network
Displays network interfaces and corresponding network traffic. Read only.
Memory
Displays Physical and swap memory usage. Read only.
Other Services
Lists XiVO related processes (most of which are daemons) with their corresponding status, uptime, resource usage and controls to restart service, stop service and stop monitoring service.